

histogram
 4
6.1
4
6.1

- noun
- /ˈhɪstəˌɡræm/
- Specialized
 :
histograma
:
histograma
- This histogram displays the frequency of test scores among students in the class.
- histograms showing the frequency
- histogram of the distribution
- histogram shows
And you and you class and you set up a histogram with unambiguous males, unambiguous females.
- And you and you class and you set up a histogram with unambiguous males, unambiguous females.
- So it's like article histogram and photon energy box.
Examples
-
And if you were to graph all the numbers from this population, you would have a histogram that would look roughly bell shaped.
-
After all the responses are in, the system displays the answers in a histogram like that given in figure 3.
Academic text (2005) -
And the age histogram in the developing world will come to look rather more like the one on the right.
-
OK, so if I plot that histogram, it looks like this.
-
This shows the number of venture capital funds, the histogram and the average size of a venture capital fund in millions of dollars.
-
Figure 12 shows a frequency histogram from the "Chart" feature in COCA.
Academic text (2018) -
This only says that when you make a histogram of the masses of the planets, there are more small planets than big planets.
-
Pretest scores were charted as a histogram that showed a relatively normal population.
Academic text (1995) -
Figure 10 shows a histogram of peak spacings for a data pattern containing roughly 20,000 marks.
Academic text (1995) -
In the majority of cases, the velocities histogram displayed two clearly distinguishable peaks (Figure 6F).
Academic text (2016)
Synonyms
 420
1.3
420
1.3
A picture like a graph or table that shows information clearly
 131
2.8
131
2.8
A diagram that shows data using lines, bars, or dots
 2
3.1
2
3.1
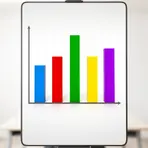
A chart that uses bars of different lengths to show and compare numbers
 1
3.0
1
3.0
A graph with bars that show and compare numbers for different groups


 1
4.7
1
4.7
A table or chart that shows how often each value appears in a set of data
How Detailed

Surface Forms
Etymology
The word histogram comes from Greek parts histo- meaning a 'mast' or 'upright' post and -gram meaning a 'drawing' or 'written thing', the same ending as in diagram. So a histogram is a drawing of upright bars whose heights show how often numbers appear in the data.