

graph
 131
2.8
131
2.8

- noun
- /ɡræf/
- This bar graph shows the increase in sales over the last five years.
- bar graph
- charts and graphs
- figures and graphs
Loading YouTube…
Watch on YouTubeThe blue points are where the graph crosses the Y axis.
- The blue points are where the graph crosses the Y axis.
- And anyone know what the graph of this is?
- Well, for the parent graph is just π, right?
- There's a whole graph and pie chart and pie graph and pie something.
Examples
-
Can you explain what that graph shows, please?
-
This chart right here is a graph of consumer prices.
-
OK, here is a graph of those data.
-
And so this graph is pretty wild.
-
Your sales graph here, shows a thirty five percent decline in sales after your first ten years at the company.
-
This is a Google Trends graph of your name searched over time.
-
All the technicians stand, staring at the central board, where a graph shows the drilling progress.
Fiction book (1998) -
Words sometimes don't persuade, but a graph will be more persuasive.
-
We've got about six pages of graphs and summary data.
-
I've made a graph.
Synonyms
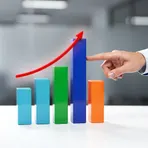 420
1.3
420
1.3
A picture like a graph or table that shows information clearly
 88
2.8
88
2.8
A simple drawing that shows how something works or how its parts fit together
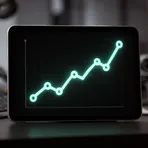 36
3.6
36
3.6
A graph that shows how numbers change over time
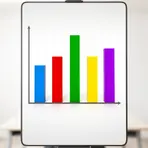 2
3.1
2
3.1
A chart that uses bars of different lengths to show and compare numbers
 1
3.0
1
3.0
A graph with bars that show and compare numbers for different groups
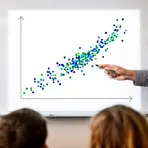 1
4.4
1
4.4
A graph that shows how two things are related using dots
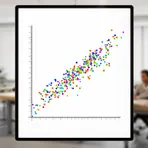
A graph that shows dots for two sets of numbers and how they relate
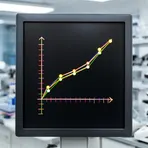
A picture that shows how numbers relate using points or lines on two lines called axes
A chart that shows numbers or data so you can see trends
Compounds

How Detailed

Surface Forms
Etymology
Graph comes from the old Greek word graphein, which means 'to write' or 'to draw'. The same root is in autograph and photograph, so a graph is like a 'drawing' of data that helps you see patterns.