

bar chart
 1
3.0
1
3.0

- noun
- /bɑr tʃɑrt/
- Your first bar chart tracks the ways that couples have met.
- bar chart showing
- bar chart or graph
Loading YouTube…
Watch on YouTubeSo if we look at the product type, so the blue corresponds to plant based type foods and the orange bar charts corresponds to different types of meat.
- So if we look at the product type, so the blue corresponds to plant based type foods and the orange bar charts corresponds to different types of meat.
Examples
-
This question was addressed with a visual analysis of the data using bar charts and flow charts for individual students.
Academic text (2009) -
In our presentation, we used a bar chart to compare the population sizes of various countries.
-
You all know how to read a bar chart.
-
Will a bar chart tell the story?
Academic text (2010) -
This representation of data is nowhere near as easy to read as a simple bar chart.
Blog text (32) -
All the graphs in each decision case were bar charts.
Academic text (2002) -
This next bar chart tracks the consumption of cheese for every country in the world as measured by kilogram Eaton per person per year.
-
Bar charts are the most common method used to graph financial data in annual reports (Steinbart 1989).
Academic text (2002) -
For example, decision makers can extract specific point values faster from bar charts than from line graphs (Tan and Benbasat 1993).
Academic text (2002) -
Likewise, Carswell (1991) found that bar charts, embellished to show depth, reduced decision accuracy and induced more favorable attitudes toward the data.
Academic text (2002)
Synonyms
 420
1.3
420
1.3
A picture like a graph or table that shows information clearly
 131
2.8
131
2.8
A diagram that shows data using lines, bars, or dots
 36
3.6
36
3.6
A graph that shows how numbers change over time
 7
2.6
7
2.6
A circle divided into parts that shows how much each part is of the whole
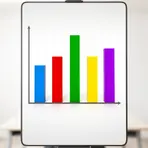 2
3.1
2
3.1
A chart that uses bars of different lengths to show and compare numbers
How Complex
1
3.0


 1
4.1
1
4.1
Surface Forms
Morphology
The meaning 'a chart represented by bars' is directly and compositionally derivable from 'bar' (a bar-shaped element) + 'chart' (a visual display of data); a B1 learner who knows both constituents can infer the concept. This is a regular noun compound pattern seen cross-linguistically, so the relation is predictable and transparent.
Etymology
Bar chart comes from the simple picture of long bars: bar means the long rectangles and chart is a picture that shows numbers. Each bar's length shows a value, so the image helps you 'compare' different amounts.