
frequency distribution


 1
4.7
1
4.7
- noun
- /ˈfriːkwənsi dɪstrɪˈbjuːʃən/
- Specialized
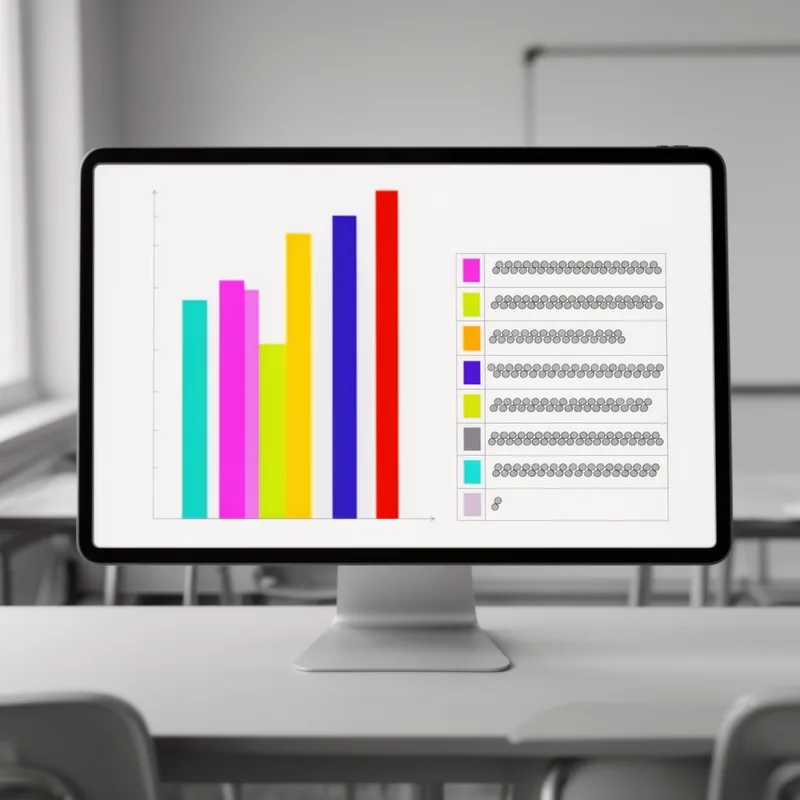
- Figure 2 shows the frequency distribution of scores from the DAPMA.
- percentage frequency distribution
- cumulative frequency distribution
- Table of frequency distributions
Examples
-
The first analysis consisted of obtaining a frequency distribution for each physical activity category within each program.
Academic text (1990) -
Table 1 presents the frequency distribution and comparisons of responses with respect to selected demographic characteristics.
Academic text (2003) -
Table 1 shows the frequency distribution for these two sample groups.
Academic text (2008) -
Statistical analysis, including frequency distribution and percentage difference, was then performed.
Academic text (2013) -
Table 2 displays the frequency distribution for the episodes as classified by activity category per Saturday.
Academic text (1990) -
Statistical analysis: A frequency distribution was determined for the reaction of lines within individuals to each HG type.
Academic text (2015) -
Analysis of survey data included frequency distributions and reliability analyses.
Academic text (2008) -
We used chi-square tests to check the equality of the frequency distributions.
Academic text (2004) -
Descriptive statistics and frequency distributions were generated for the whole sample and for the homogeneous grade groups.
Academic text (2004) -
Table 1 shows the frequency distribution for these two sample groups.
Synonyms
 43
4.9
43
4.9
How numbers spread across a set of results, often shown on a graph
 4
6.1
4
6.1
A picture using bars to show how often numbers appear
 1
5.3
1
5.3
A way to show how often different values occur in data like test scores
How Concentrated
- Specialized

- Specialized
1
4.7
- Specialized
2
5.8
- Specialized
Surface Forms
Morphology
The meaning is directly compositional: 'frequency' (how often something happens) + 'distribution' (how values are spread) yields the distribution of frequencies, i.e., how often each value occurs. This noun–noun combination follows a regular, cross-linguistically common pattern (e.g., Spanish 'distribución de frecuencias'), so a B1 learner who knows both constituents can reliably infer the meaning.
Etymology
The term frequency distribution comes from two simple ideas. Frequency means 'how often' and distribution means 'how things are spread out'. So a frequency distribution is like a picture that shows how often each value appears in a list of numbers.