
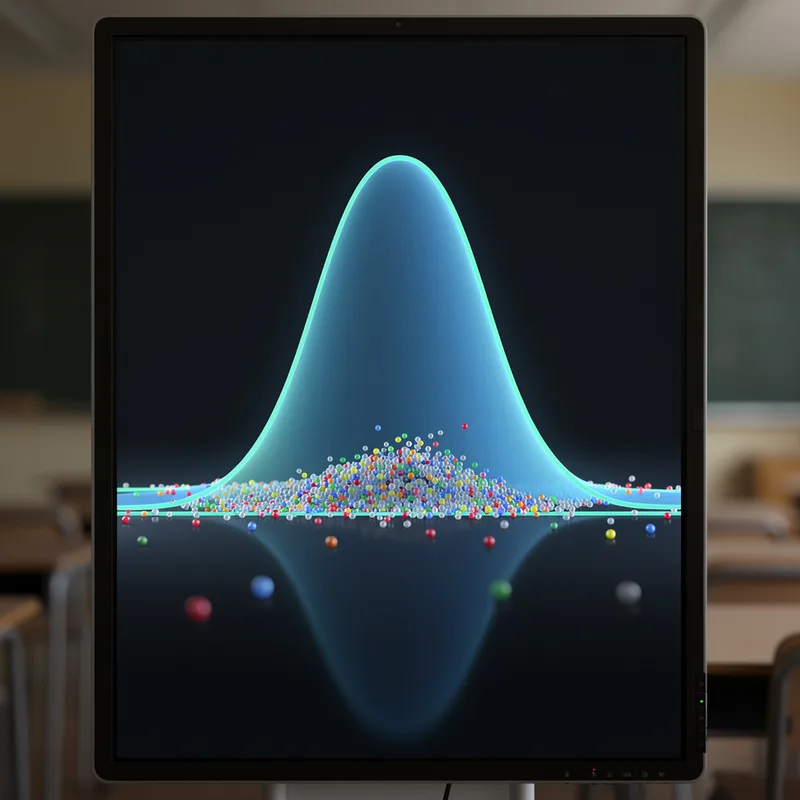
normal distribution
 2
5.8
2
5.8

- noun
- /ˈnɔrməl dɪsˈtrɪbjuːʃən/
- Specialized
- The heights of adult males in a given population typically form a normal distribution, with most individuals close to average height.
- a standard normal distribution
- assume a normal distribution
- approximate a normal distribution
Loading YouTube…
Watch on YouTubeWe're taught that in schools by there being a normal distribution for grades.
- We're taught that in schools by there being a normal distribution for grades.
- You've mentioned the normal distribution, so let's talk about it.
- We know that we can generate a normal distribution by calling random gauss.
- All right, ladies and gentlemen, if I had a blackboard, I would draw a normal distribution.
- And the power of the normal distribution is that it amazingly works for sets of data that you wouldn't even begin to think it would possibly work for.
Examples
-
So this is called the normal distribution or the Gaussian distribution.
-
The assumption of a normal distribution may not meet the needs of some situations.
Academic text (1992) -
We're taught that in schools by there being a normal distribution for grades.
-
You've mentioned the normal distribution, so let's talk about it.
-
With these two parameters known, the normal distribution curve for flow intensity can be easily constructed.
Academic text (1996) -
Now if you have a symmetric distribution like the standard normal distribution, then the mean and median are identical.
-
Alternatively, if we assume a normal distribution, we can develop a 0.95 confidence interval.
Academic text (1992) -
When the criteria for normal distribution were not met, non-parametric methods were used for comparisons.
Academic text (2000) -
A Kolmogorov-Smirnov test revealed that predicted yield values in each subgroup show a normal distribution.
Academic text (2017) -
Scores on these three scales show close to normal distributions in nonclinical samples of both men and women.
Academic text (2004)
Synonyms
 7
4.6
7
4.6
A curved line on a graph showing most results near the average and fewer at the ends
 1
7.5
1
7.5
A bell-shaped curve used in statistics to show how values spread

 1
6.7
1
6.7
A bell-shaped pattern that shows most values are near the average, like heights or test scores
 1
4.2
1
4.2
A curve shaped like a bell that shows most values near the average

A bell-shaped line that shows most numbers near the middle and fewer far from it

A bell-shaped curve the same on both sides that shows how values are near the average
A smooth bell-shaped curve that shows how values spread around the average
How Concentrated
- Specialized

- Specialized
1
4.7
- Specialized
2
5.8
- Specialized
Surface Forms
Morphology
The compound literally combines 'normal' (typical) and 'distribution' (how values are spread), so a B1 learner who knows both words can infer a rough meaning — a typical or standard way data are distributed. However, the precise statistical properties (symmetry about the mean, bell-curve shape and probability interpretation) are technical and not predictable from the constituents alone, so full comprehension requires prior exposure or instruction.
Etymology
Normal distribution comes from a simple picture: a bell-shaped curve that is highest in the middle and low at the sides, so most values are near the 'average' and only a few are far away. That's why normal distribution describes data where most numbers are 'typical' and close to the 'average'.