
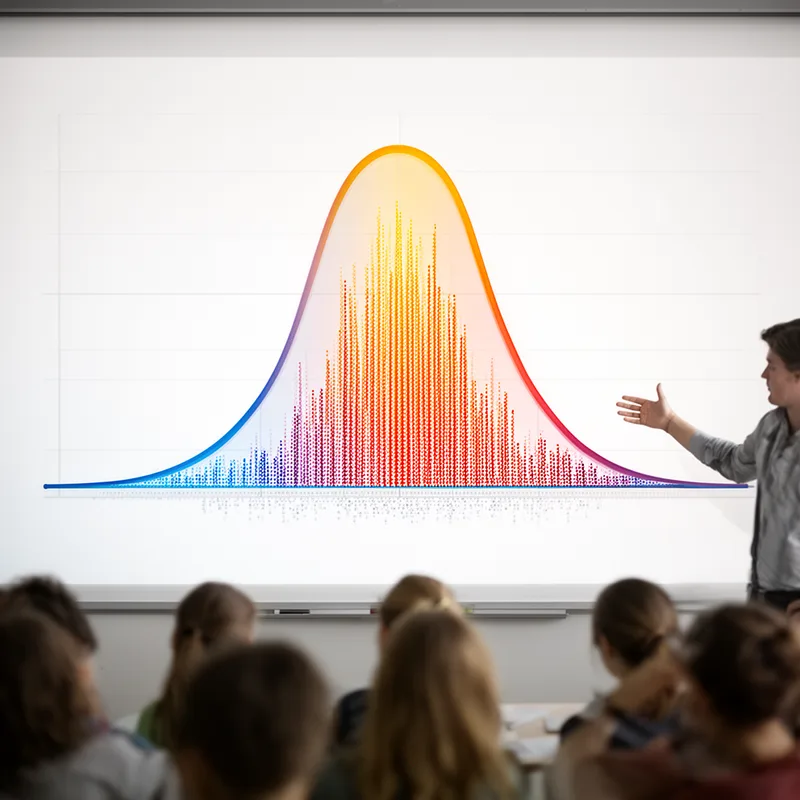
normal curve
- noun
- /ˈnɔrməl kɜrv/
- Specialized
- The graph of test scores formed a normal curve, indicating that most students scored near the average.
- normal curve equivalent
- fit the normal curve
- normal curve distribution
Loading YouTube…
Watch on YouTubeSo he believes that traits followed a normal curve rather than Mendelian genetics.
- So he believes that traits followed a normal curve rather than Mendelian genetics.
Examples
-
Then they could measure the height of all the ten-year-olds in the school, graph the data into a normal curve, and suggest probability again.
Academic text (1998) -
With these parameters, the corresponding areas under the normal curve can be calculated using the Normal Distribution Tables.
Academic text (1996) -
And that tells me the shape of the bell curve, shape of the normal curve, how fast things drop off.
-
When the normal curves are drawn based on these statistics, there is clearly more overlap than difference for the two groups.
Academic text (1996) -
The percentage of students achieving at a level 2 standard deviations above the mean was not significantly different from normal curve expectations.
Academic text (1993) -
For purposes of this study, only the normal curve equivalent scores (NCEs) were used.
Academic text (1994) -
The subscale scores are compared by graphing them onto a normal curve equivalent percentile chart.
Academic text (1995) -
Each test yields raw scores, standard scores, percentile ranks, and normal curve equivalents.
Academic text (2012) -
The Spring 2004 third-grade CAT6 normal curve equivalence reading composite scores were used for all analyses.
Academic text (2008) -
The people who make these tests are like me, kind of mesmerized by the normal curve and the elegance of the stats that underlie the normal curve.
Academic text (2016)
Synonyms

 7
4.6
7
4.6

A curved line on a graph showing most results near the average and fewer at the ends
 2
5.8
2
5.8
A bell-shaped curve where most values are near the average
 1
7.5
1
7.5
A bell-shaped curve used in statistics to show how values spread


 1
4.2
1
4.2
A curve shaped like a bell that shows most values near the average
 1
6.7
1
6.7
A bell-shaped pattern that shows most values are near the average, like heights or test scores

A bell-shaped curve the same on both sides that shows how values are near the average
A smooth bell-shaped curve that shows how values spread around the average
Surface Forms
Morphology
The phrase is compositionally built from 'normal' + 'curve', so a learner can infer it denotes a curve that is typical or standard; however the specific statistical sense — a symmetric, bell-shaped distribution with particular probabilistic properties — is technical and not fully predictable from the constituents alone. Because the core idea is partly transparent but requires domain knowledge for the full meaning, it is best classified as semi-transparent.
Etymology
The term normal curve comes from the bell-like shape of a curve that shows many values near the middle and few at the ends. Because this picture looks like a bell with the highest point in the middle, the name now means the graph that shows the 'normal' or usual pattern of values.