

bell curve
 7
4.6
7
4.6

- noun
- /bɛl kɜrv/
- Specialized
- Plotting companies in a bell curve shows the same pattern as with workers.
- bell curve distribution
- tail of the bell curve
- end of the bell curve
Loading YouTube…
Watch on YouTubeBecause so often we, we forget that there's a big fat center to the bell curve.
- Because so often we, we forget that there's a big fat center to the bell curve.
- And how I can explain this best is known as a bell curve.
- When we predict an expected return and the standard deviation, we're essentially predicting a bell curve of future likely returns.
- It does what's called a bell curve and bell curves.
Examples
-
Take a moment and examine how the socioeconomic bell curve has flattened and continues to do so.
Blog text (19) -
Remember... half the population is on the left side of the bell curve.
Blog text (1) -
Now, as it happens, rarely do we have exams that actually fall on a bell curve like this.
-
50% of the people live on the low side of the IQ bell curve.
Blog text (10) -
When we predict an expected return and the standard deviation, we're essentially predicting a bell curve of future likely returns.
-
In a typical classroom, the test scores often follow a bell curve, with most students scoring around the average grade.
-
The bell curve illustrates how the majority of a population's traits are distributed around the average.
-
When analyzing the data, the researchers noticed that the results fit a bell curve, indicating a normal distribution of responses.
Synonyms
 2
5.8
2
5.8
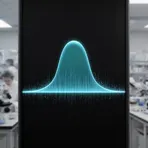
A bell-shaped curve where most values are near the average
 1
7.5
1
7.5
A bell-shaped curve used in statistics to show how values spread


 1
4.2
1
4.2
A curve shaped like a bell that shows most values near the average

A bell-shaped line that shows most numbers near the middle and fewer far from it

A bell-shaped curve the same on both sides that shows how values are near the average
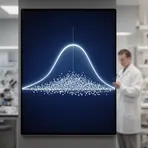
A smooth bell-shaped curve that shows how values spread around the average
Surface Forms
Morphology
The meaning — a curve shaped like a bell (used to show a normal distribution) — is directly and transparently built from 'bell' (bell-shaped form) + 'curve' (a bent or plotted line), so a B1 learner who knows both words can picture a bell-shaped line. This descriptive, pictorial compound is cross-linguistically common and follows ordinary noun-noun composition, making it transparent even if the statistical concept 'normal distribution' might need extra instruction.
Etymology
Bell curve comes from the shape of a line on a graph that looks like a bell and so is a curve with a high middle and low sides. That picture shows why bell curve means most values are near the 'average' and fewer are far from the middle.