
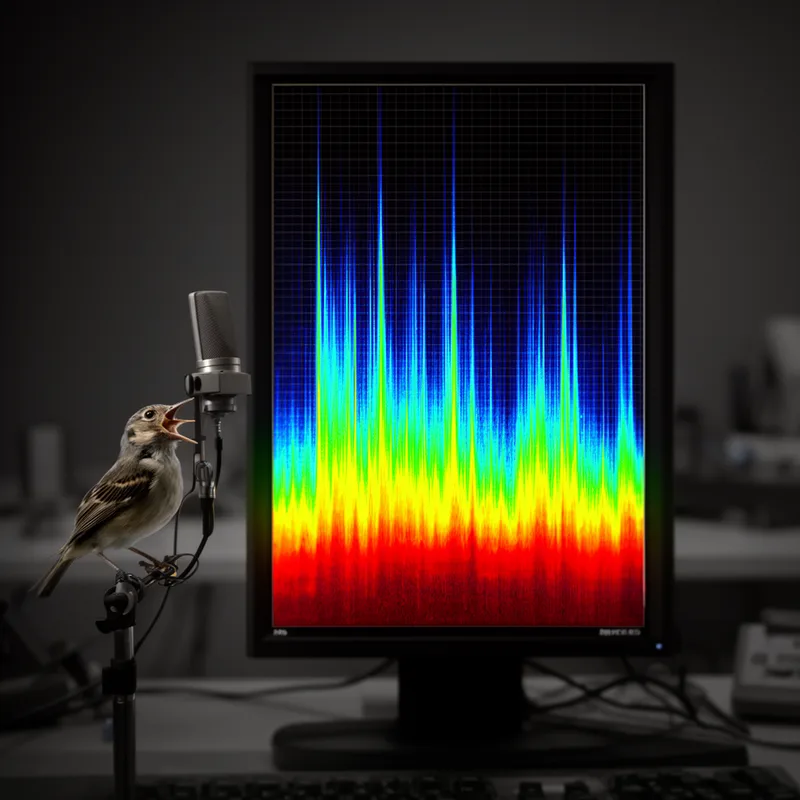
spectrogram
 1
8.3
1
8.3

- noun
- /ˈspɛktrəˌɡræm/
- Specialized
- Researchers analyzed the data from a spectrogram to study the characteristics of the dolphin calls.
- spectrogram and waveform
Examples
-
No axis labels or scales were provided, but we presume the frequency scale for the spectrogram was ten times that for the f0 tracks.
Academic text (2017) -
What you are about to see are spectrogram images of Neptune.
-
Spectrograms of selected coded C and V signals are shown in natural speech signals.
Academic text (1991) -
The practitioner made spectrograms of /o/ tokens from both the known and questioned speaker recordings.
Academic text (2017) -
Examining the spectrogram of postvocalic liquids can also provide an objective indication of vocalization.
Academic text (2015) -
Each acoustic cue was identified by visual inspection of the waveform and wideband spectrogram while listening to the utterance.
Academic text (2013) -
We measured the duration of each vowel in pre- and post-boundary syllables based on the waveform and spectrogram.
Academic text (2011) -
The engineer used a spectrogram to visualize the sound frequencies emitted by the engine.
-
By comparing the spectrogram outputs, they were able to identify distinct patterns in the audio recordings.
Synonyms
 1
4.6
1
4.6
A picture that shows how high and low parts of a sound change over time

 1
9.2
1
9.2
A picture that shows the pattern of colours or lines made by light from something
How Detailed

Surface Forms
Morphology
spectrogram = spectrum (semi-transparent) = spectro + gram
The relation 'spectrum' + '-gram' ('a recording of a spectrum') is derivable but uses technical combining forms that may be unfamiliar to general learners.
Etymology
Spectrogram breaks into spectro- meaning 'look' or 'image' (as in spectrum and spectacle) and -gram meaning 'something written' (as in telegram). So a spectrogram is like a 'written picture' of a spectrum that shows different frequencies and how strong they are, which is why we use it to view sound or light patterns.