

graphical recording
- noun
- Specialized
- The data is represented in a graphical recording that displays the relationship between temperature and pressure.
Examples
-
The scientist analyzed the graphical recording to identify trends in the data.
-
The graphical recording showed a clear trend over time.
-
A clear graphical recording can help explain complex results to a wider audience.
-
Modern lab equipment produces a digital graphical recording of each experiment.
-
Can you create a graphical recording of the data?
-
During the presentation, the researcher used a graphical recording to illustrate the correlation between the variables more effectively.
-
By studying the graphical recording, we were able to observe how the sales figures fluctuated throughout the year.
Synonyms
 420
1.3
420
1.3

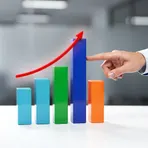
A picture like a graph or table that shows information clearly
 131
2.8
131
2.8
A diagram that shows data using lines, bars, or dots


 1
4.1
1
4.1
A chart that uses small pictures to show how numbers compare
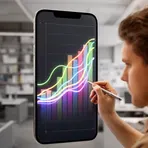
A chart that shows numbers or data so you can see trends
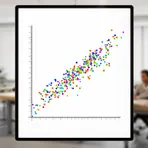
A graph that shows dots for two sets of numbers and how they relate

A chart that shows how numbers relate so you can read values

A diagram that helps you find numbers for related values by lining up scales

A chart that shows a vehicle's speed and distance over time
How Detailed

Surface Forms
Morphology
The meaning is transparently built from 'graphical' (relating to visual plots/charts) modifying 'recording' (the act or product of recording); a B1 learner who knows those constituents can infer it refers to a visual representation of recorded data. The compound follows regular English derivation (record -> recording) and a cross-linguistically common modifier+noun pattern, so the sense is immediately comprehensible from the parts.
Etymology
Graphical recording comes from old lab machines that drew lines on paper as they measured things, so graphical means a drawn picture and recording means keeping the measurement. That's why the phrase means 'a visual record of data'.