
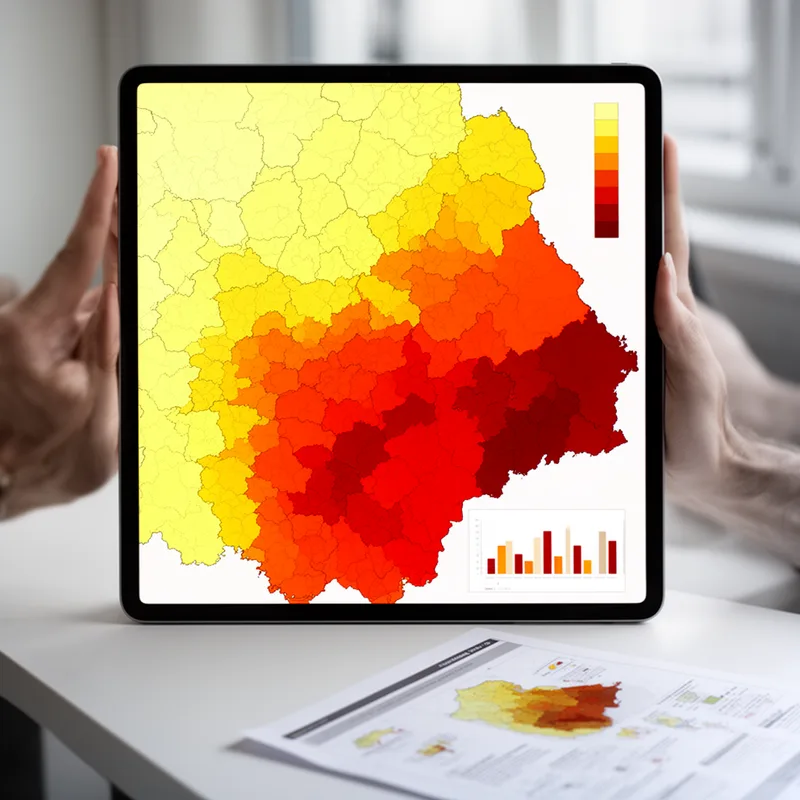
choropleth map
- noun
- /ˈkɔːrəˌplɛθ mæp/
- Specialized
- A choropleth map can effectively illustrate varying levels of education attainment across different states.
Examples
-
In her presentation, she showed a choropleth map to highlight income inequality in urban areas.
-
The researcher used a choropleth map to display the population density across different regions of the country.
-
These data were merged with a digitized boundary file of China in Atlas-Graphics mapping software to make basic choropleth maps.
Academic text (1991)
How Distorted


Surface Forms
Morphology
choropleth + map
The key element 'choropleth' is a specialised, Greek-derived technical word (no common dictionary definition provided) and is not transparently analyzable by a B1 learner; 'map' alone does not convey the specific sense of shading/patterning by variable. Because the crucial meaning depends on an opaque technical modifier rather than a predictable compositional pattern, the overall phrase cannot be inferred without prior exposure or explanation.
Etymology
Choropleth map comes from two old Greek words: choros meaning 'area' and plethos meaning 'many'. The name gives a clear image: each whole 'area' on the map is shaded to show how 'many' or how much of something is there. So, it means a map that colours regions to show values.