
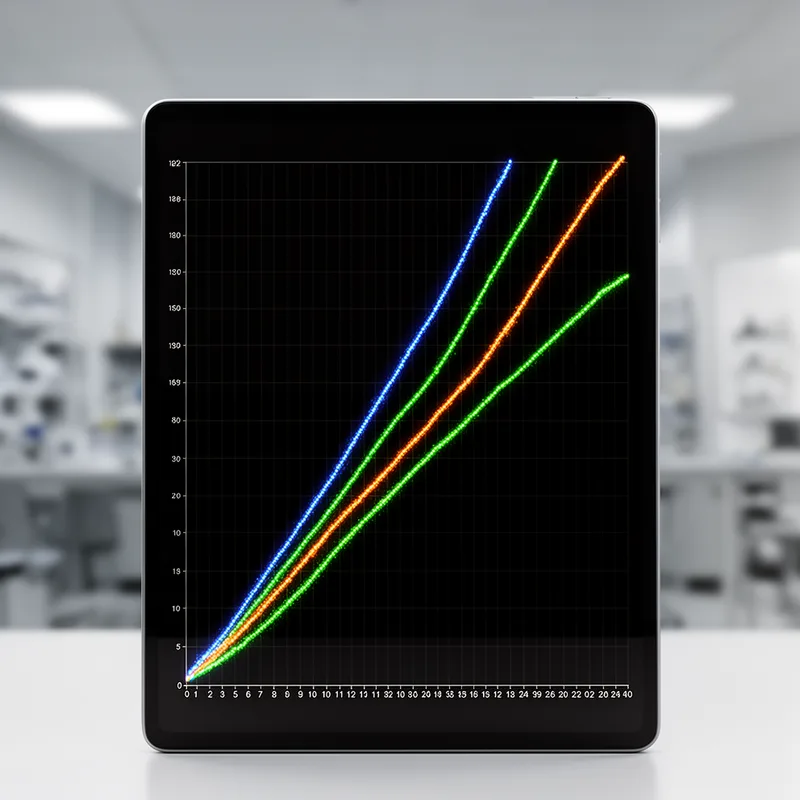
semilog


 1
8.4
- noun
- /ˈsɛmɪˌlɔg/
- Specialized
- When studying the bacteria, we found that a semilog plot helps visualize the rapid increase in population over time.
Examples
-
The researcher displayed the data on a semilog graph to better illustrate the exponential growth patterns.
-
Table 1 presents results from several regressions controlling for race and using the traditional semilog functional form for salary regressions.
Academic text (2017) -
We first analyze salary with a semilog regression model, adding controls for regions, demographic characteristics, educational characteristics, employer characteristics, and occupation.
Academic text (2017) -
Instead, the use of, for example, multilevel/hurdle regression or simple semilog regression with relapses as a continuous variable would have produced more reliable results.
Academic text (2016) -
In our analysis, we chose to use a semilog scale to accurately represent the varying rates of growth across different samples.
Surface Forms
Morphology
Etymology
Semilog combines semi- 'half' or 'partly' with log short for 'logarithm', the same 'log' you see on a calculator. So, a semilog is a graph that is 'half log' because one axis uses a 'log' scale to show large ranges and the other axis is linear.