

frequency-response curve
- noun
- /ˈfriːkwənsi rɪˈspɒns kɜːrv/
- Specialized
 :
curva de respuesta de frecuencia
:
curva de respuesta de frecuencia
- The engineer analyzed the frequency-response curve to optimize the circuit's performance.
Examples
-
We kick these over to the lab to test though, and shockingly, the frequency response curve is not that far off our target.
-
A clear understanding of the frequency-response curve helps in designing more efficient filters.
-
By adjusting the parameters, we can improve the frequency-response curve of the audio system.
Synonyms


 1
6.9
1
6.9
The amount a device or system changes output at different frequencies
 1
7.2
1
7.2
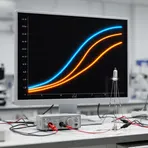
A graph that shows how one device property changes as another thing changes, like voltage or temperature
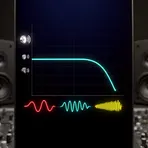
A graph showing how loudness changes across low and high tones
Surface Forms
Morphology
frequency-response + curve
The phrase is directly compositional: 'frequency' (how often or the rate) + 'response' (reaction or output) + 'curve' (a plotted line), so a learner who knows the constituent meanings can infer it denotes a plotted line showing how a system's response varies with frequency. Although used in a technical domain (electronics, acoustics), the basic semantic relationship is transparent and follows common noun–noun compounding patterns.
Etymology
Frequency-response curve comes from the simple idea of drawing a line that shows how each frequency, or pitch, causes a different response, or loudness, so the points on the graph make a curve. So, it means a graph that shows how a device or system 'responds' to different 'frequencies'.