
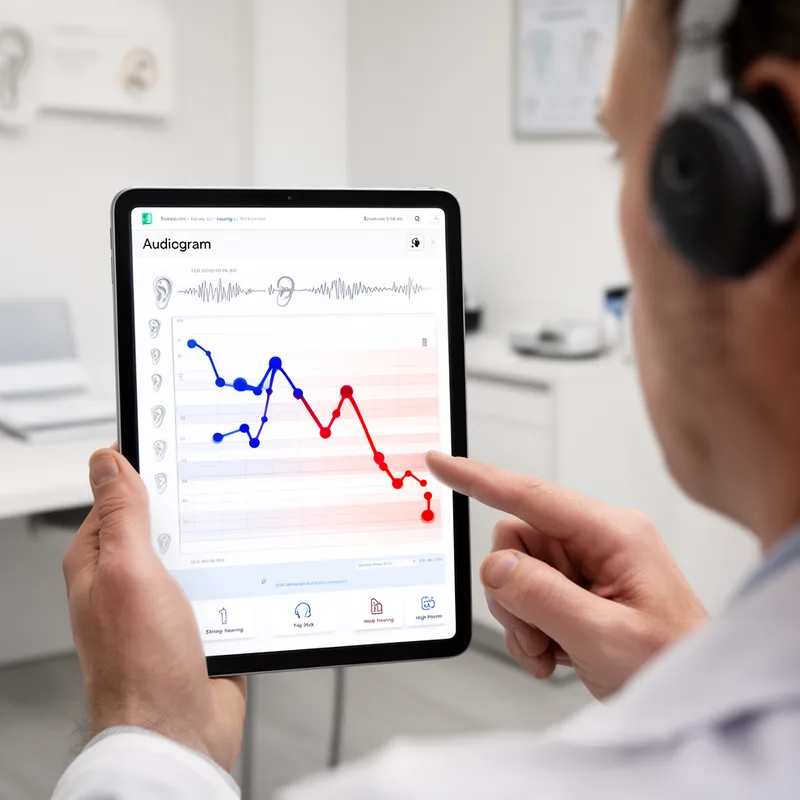
audiogram


 1
7.9
- noun
- /ˈɔːdiəˌɡræm/
- Specialized
- The results of the audiogram revealed that the patient had normal hearing capability from 250 Hz to 8000 Hz.
- pure-tone audiogram
- tone audiogram
- preoperative audiogram
Examples
-
On an audiogram, this type of hearing loss configuration is commonly referred to as a "noise-notch."
Academic text (2008) -
Case 2: Audiogram of the left ear shows that hearing is within normal limits.
Academic text (1999) -
And this is the audiogram from someone who lacked a middle ear.
-
Both right and left ear audiograms were included in the sample.
Academic text (1996) -
The left panel includes the pure tone audiogram and comfort levels from the loudness test.
Academic text (1993) -
The first thing you'll notice about the audiogram is that pinkish blotch near the top.
Blog text (23) -
Findings were consistent with expectations from routine audiograms, and no unusual high-frequency patterns were detected.
Academic text (1995) -
For example, we might describe one audiogram as "type A, peak at 2000 Hz, dip at 4000 Hz."
Academic text (1995) -
Basic audiology included a complete audiogram, air and bone conduction, speech testing, tympanometry, and acoustic reflexes.
Academic text (1996) -
Although these generalizations may apply to most individuals, it is best to consult each traveler's audiogram to evaluate frequency-specific thresholds.
Academic text (1997)
Surface Forms
Morphology
Etymology
Audiogram comes from the parts audio- 'to hear' and -gram 'a written thing', like in diagram, so it literally means a 'picture of hearing'. That's why an audiogram is a graph or picture that shows how well someone hears different sounds.